“Help! I am tangled up in the plot!” Said Isla as we were hiking our way out to Collinson Head to start the most exciting part of our field work data collection all summer – the point framing of the long-term monitoring plots. That entanglement – from which Isla was soon rescued – was the inspiration behind the title of this blog post.
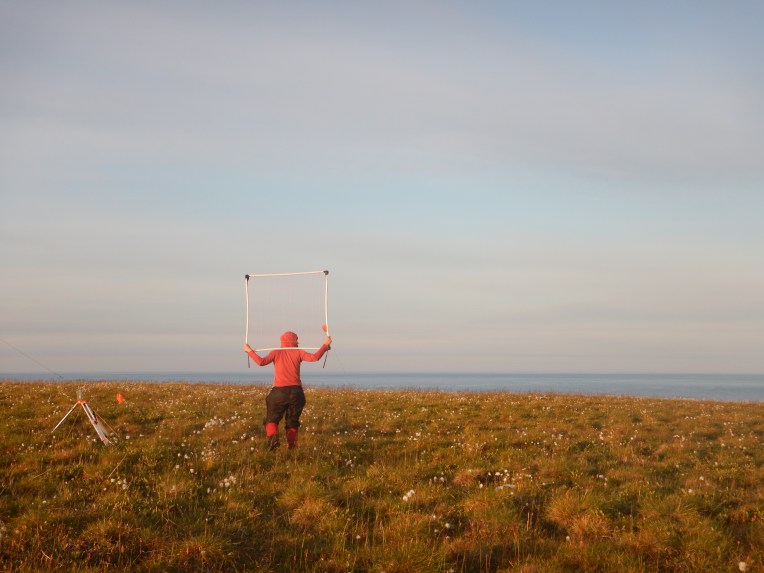
It was a long stretch of hot days, almost as hot as the hottest day of the year, when, amidst the buzzing of mosquitos and boat noises, dramatic words echoed through the tundra – hour after hour, one could overhear: “Three live, two standing dead”, “Salpul, seven point four”, “Wait, how many were dead?”, “Four dead.” The soundscape of point framing!
We have been going back to the same 1 x 1m plots on Qikiqtaruk for six years now – half of the plots are in the Herschel vegetation type, and the other half in the Komakuk vegetation type. The communities there are very different, as we previously pondered in our first book club blog post after we started reading Mark Vellend’s “The Theory of Ecological Communities”. We have kept up reading the book in between fieldwork this summer, and point framing in particular has been a thought-provoking companion to our reading. We will be posting our second book club post soon, but until then, grab an imaginary pin flag, and picture yourself in the tundra landscape as we share with you our impressions from the 2017 point framing season.
- Interestingly, we recorded 32 species in both the Herschel and Komakuk plots. Even though observed species richness is the same, the identity of the species and their frequency in the two vegetation types are very different.
- The Herschel vegetation type, where one can often find patches of moss in between the cottongrass tussocks, is much more pleasant for barefoot walking than the Komakuk vegetation type, where there is an abundance of spikey dead flower stalks of grass species! The mosquitos had scared us off from kicking our shoes off at first, but the heat finally convinced us to throw our cares and socks to the wind.
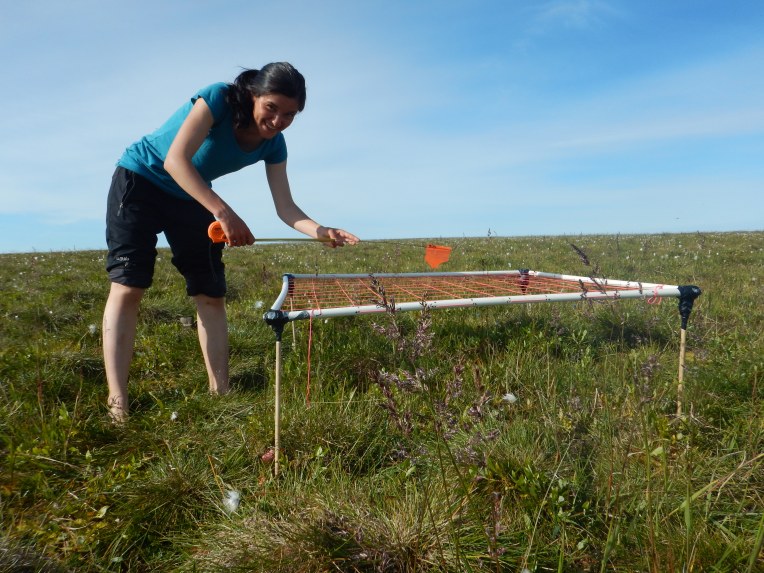
Gergana enjoying the refreshing feel of mosses on her feet. - We are very thankful for iPads and the Numbers app! We collected over 4200 rows of data, entered straight into the iPad, which means we don’t have to spend weeks digitising it from fieldbooks! We can now load our data right into R and analyse it when we get back from a day in the field. For anyone reading this post who hasn’t yet switched over to digital data collection – make the switch now, it will change your life!
- We looked over the data from previous years and checked out what interesting things were “hit” with the pin flag – a spider, some caribou poo, little pools of standing water and more. No wildlife touched our pin flag this year, but there were still plenty moments of excitement. For example, amidst walking between the plots, I spotted the biggest Salix arctica leaf I’ve ever seen, measuring at 11.4 cm! There were beautiful patterns of moss and Peltigera lichen patches, which inspired us further – point framing is very repetitive, so anything to break the sequence of dead and live Eriophorum leaves is exciting!
- We also conducted a new protocol – the International Tundra Experiment species pool protocol, which I was most excited about. Point framing is great, and it’s even better when you combine it with a survey of what plant species are present in the area around the plot! We walked in bigger and bigger concentric circles, starting from the center point of our plots, till we reached a radius of 100m, which is pretty far when you are walking in circles to get there! Then we recorded each new species, the distance at which it was found, as well as its vegetative and reproductive height. This is the best kind of treasure hunt – biodiversity monitoring! We have been dreaming of species-accumulation curves ever since, and once our data and graphs make it off the island, we shall be sharing those with all of you!
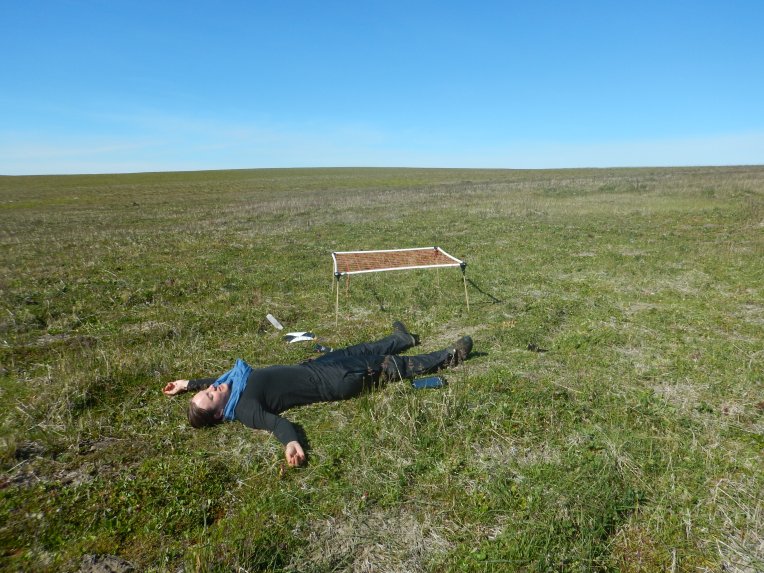
Isla taking a tundra nap in between two sets of point framing. - We were surprised to find so many different plant species – within a 100m radius of the plots, we identified 66 species for Komakuk, and 55 species for the Herschel vegetation type – currently only 32 of them are present in the plots, and we can’t wait to see if and how selection, dispersal and drift change the plant composition in the future. New species could disperse into the plots or species might disappear by random chance or because they are out competed by other faster growing plants! Community ecology is so exciting!!!
In summary, for four days, our lives were indeed tangled up in plots, but what a great tangle to be in! We will be sharing graphs and more thoughts on community ecology in the Arctic in our next book club blog posts, so stay tuned.
By Gergana

I have just found your very nice blog. I just stubled on to this post and noted your recommendation of iPad. Do you have any ekstra protection for the tablet you use? E.g. rain-protector? And are you able to use it in moist weather? I was also wondering how you experience the risk of errors when entering directly on a table? (Compared to note bokk use).
LikeLike
We are just working on a blog post about our digital data collection for the Dynamic Ecology blog. I will send you the link once it is live. We do use a “waterproof” protector for our iPads. We have tried out a few different ones and some are more waterproof than others. We have used the iPads in relatively torrential rain and they still work better than pencil and paper under those conditions, but it is a bit harder when rain is covering the screen and your fingers are cold! I think the error risk is lower with iPad data entry as you are able to catch more stuff than with a field note book. You can define what kind of data you expect for a given column and can specify the significant digits and such. Taking screen captures prevents data loss due to any file version issues. We haven’t run into any major issues on the error risk and data back up front in our three years of iPad-based field data collection. Check out the blog post for more information, once the link is live.
LikeLike
Thank you so much for your reply! I really look forward to your reading your post on digital data collection. /Ida
LikeLike