One of my first tasks as the Kluane Research Assistant was to set up phenocams in the common garden experiment. Phenocams, or more generally time lapse cameras, take pictures every hour to create a video of what has happened over time. Differences in the timing of life events (phenology) – things like when leaves appear or die – are probably one of the biggest drivers of the difference in growth we are seeing between willow populations. With phenocams we can now track this throughout the whole year!
Posts awaiting phenocams
My first step was to unbox them, which, I have to say was the most time consuming! I was to put up 12 cameras around the garden to monitor certain plots, with another one going to be put in a tree to get an aerial view.
After all was unboxed, it was time for the set-up. The instructions were very clear and allowed for the cameras to be customized to our liking. I inputted the time and date and chose the name for each camera. This information will be displayed at the bottom of each picture when the whole video comes together. Being able to name each camera makes it very easy to differentiate between each camera, especially when wehave so many!
Once the set-ups for all cameras was complete, I headed over to the common garden to put them up. Team Drone, who stopped in Kluane earlier this summer, thankfully put up the posts where I was to attach the cameras. At first I wasn’t too sure how I’d be able to set them up but thankfully each camera came with aconnecting band and clasp that I found was long and strong enough to attach each camera securely. The outcome looks pretty good and hopefully the final resulting images will too!
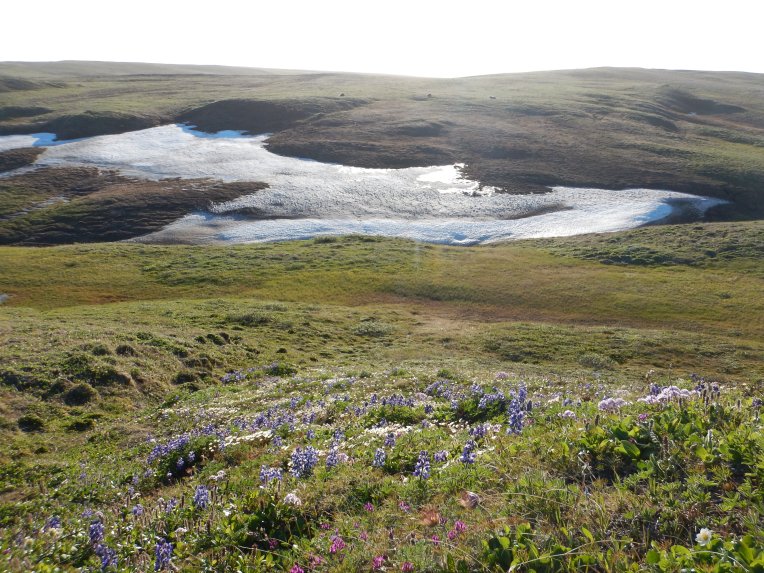
It’s a hot day. The sun is beating down on the damp ground, freshly cleared of melted snow, and beneath the wet surface the ice begins to retreat.
Nothing too unusual, except that it’s the middle of April, and our field site is an island off the Arctic coast of Canada. Thirty years or so previously things would still have been buried under a thick blanket of winter snow, but as the Arctic heats up, spring is advancing.
All big questions, all with big consequences for the shape and colour, the sights and smells, the ebb and flow of life for plants, animals and people alike in these cold northern lands. We are faced with one big problem though: come the spring, there’s no-one yet around to measure anything.
But, to butcher a quote, we have a cunning plan. Three, in fact.
1. Eyes in the sky
While we may still be enjoying the cherry blossom on the Meadows and the blustery showers blowing in from the North Sea in April, our field sites are still being watched from above. Satellites give us a great deal of information, all year round, that we can use to track the timing of life (phenology) across the Arctic.
Qikiqtaruk locked up in sea ice this spring
One approach is to use the ‘normalised difference vegetation index’ (or NDVI for short) to measure the ‘greenness’ of the landscape as the spring unfolds. That works well enough, but the resolution is coarse, and clouds are causing a lot of trouble (no data) particularly in the cloudy summers of the Arctic.
Part of our research aims to link satellite data with ground-based observations. We do this using drones to collect high-resolution imagery and NDVI measurements at the landscape level: ‘bridging the gap’ between coarse resolution images from space, and very detailed monitoring data from small-scale vegetation plots. This way we get a much better understanding of what is going on when we’re not at our field sites, and at all the other places around the Arctic we will never get the chance to visit.
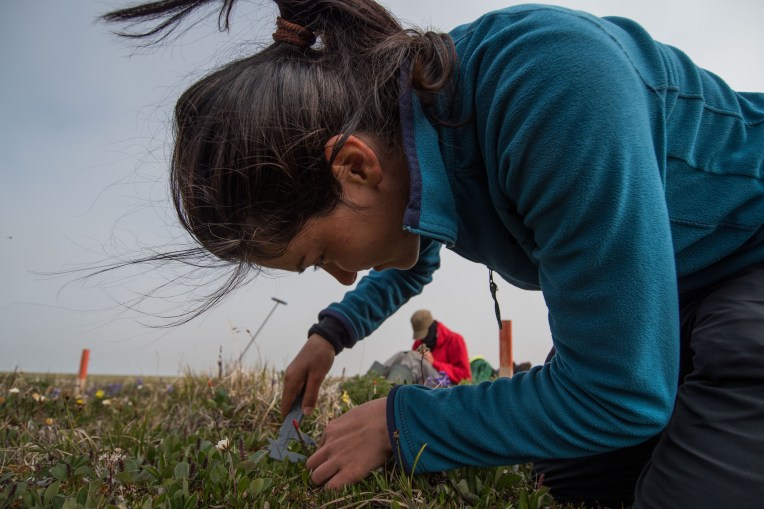
When it comes to phenology, we are incredibly lucky to be able to collaborate with Yukon Parks rangers on Qikiqtaruk – folks who not only welcome us to their lands each summer, but provide insight into the changes in the tundra in ways we never could. Three times each week from late April to early September, every year since 2001, the rangers make the half an hour hike up to sets of long-term monitoring plots to record life stages in three tundra species. They diligently record when their first leaves appear, when they flower, and when they die. Overall, this is one of the longest continuous phenology monitoring datasets in the tundra!
Checking up on the long-term phenology plots with Ricky-Joe and Sam
With data like this, we can track how plants are responding to change in much more detail. We can also compare different species: are there winners and losers? And we have the data to link things across scale: the information to build the bridge up from individual plants to the whole biome.
Gergana and Will collecting detailed growth and phenology measurements
3. Fly on the wall
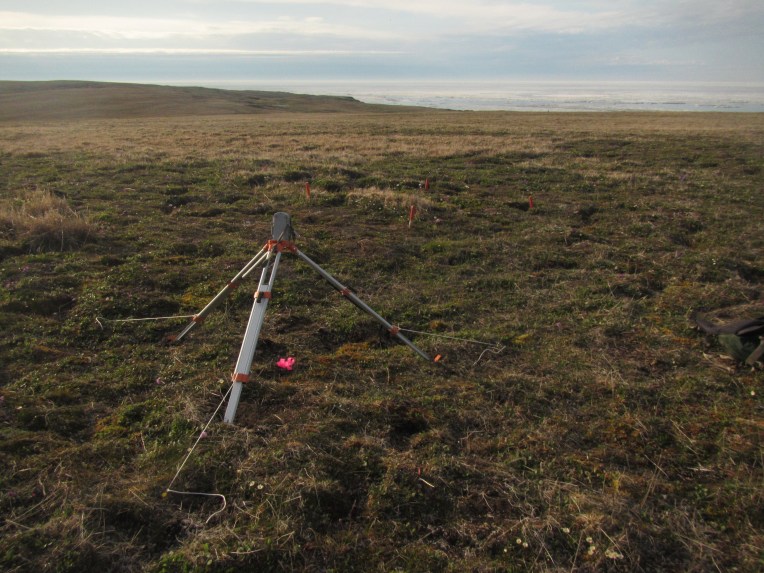
It’s never going to pull in the TV audiences of Big Brother, but a bunch of 24 hour cameras trained on Arctic plants really floats our boat. Last year we installed a couple of phenocams – basically time-lapse cameras – to track in more detail how plant communities are changing over the growing season.
This year we were fortunate enough to secure some additional funding from the Royal Geographical Society (with IBG) to expand the project. Hugely exciting for us, we will now be able to track vegetation communities across the island, scaling up our findings from the long-term monitoring plots to the landscape scale.
A phenocam standing tall above the Arctic tundra on Qikiqtaruk
Even more exciting, we are using the cameras to link differences in phenology across the Arctic through our ‘common garden’ experiment in the south of the Yukon. Here we have planted willows collected from across the Yukon to examine whether different populations will respond to change in different ways. One of the biggest differences we have seen so far is that northern populations seem to stick to their ‘home’ growing season: they leaf out late and senesce early compared to southern individuals of the same species growing just 50cm away.
Southern Salix richardsonoo
Northern Salix richardsonoo
Does the difference in senescence timing explain the difference in growth in these two willows? Willows are of the same species, collected as cuttings in 2013 from a southern tundra site (left) and northern tundra site (right).
At present we can only track phenology changes in the garden thanks to input from more wonderful collaborators – Sian Williams and the folks from Icefield Discovery working down at Kluane Lake. With our new phenocams we can for the first time track differences in phenology over the whole year, not just in our experiment, but at the sites where willows were collected! We think this is the last piece in the puzzle to be able to answer exactly what is going on – whether willows have responded to new conditions, or whether their genes mean that old habits die hard. Our phenocams in the common garden are now installed, and we’ll be installing the remainder at our remote field sites as soon as the summer expeditions get underway. Watch this space!
By Haydn
—
Haydn is the recipient of a DudleyStamp Memorial Award on behalf of the Royal Geographical Society (with IBG).